Friday, 28 June 2013

LSMW Events and Debugging


As we all know, LSMW (Legacy System Migration Workbench) is just like a tool provided by SAP to upload the data from non-SAP system to SAP system. i.e., if we are having the data in the form of text/excel file in our local system then we can easily upload this data  into SAP system using LSMW.

LSMW Events:

As in the case of reports where in we have events like INITIALIZATION, AT SELECTION-SCREEN, START-OF_SELECTION, END-OF-SELECTION, TOP-OF-PAGE, END-OF-PAGE, GET, GET LATE, PUT, AT USER-COMMAND, AT LINE-SELECTION and so on… 

Similarly even in LSMW we have the following events.

1. GLOBAL_DATA
2. BEGIN_OF_PROCESSING
3. BEGIN_OF_TRANSACTION
    -BEGIN_OF_RECORD
    -END_OF_RECORD
4. END_OF_TRANSACTION
5. END_OF_PROCESSING
6. FORM_ROUTINES


We can see all the above events in ‘Field Mapping and Rule Step’. If you are not able to see the above LSMW events then you have to click on the Layout button and check mark the Processing Times option.


LSMW Debugging:

As far as I know LSMW can be debugged in two ways.
  1.       By hard coding ‘BREAK-POINT’ in the Code section of ‘Change Field Mapping and Conversion Rules’.
  2.       By setting breakpoints in the Display Read Program/ Display Conversion Program which are automatically generated by SAP.


By hard coding ‘BREAK-POINT’ in the Code section of ‘Change Field Mapping and Conversion Rules’. 

1. Execute the ‘Change Field Mapping and Conversion Rules’ Step.
2. Open the Fields Folder.
3. Double Click on Code option.


4.  Add a new line of code ‘BREAK-POINT'.


By setting breakpoints in the Display Read Program/ Display Conversion Program which are automatically generated by SAP.

1. In order to set the breakpoints, first we have to enable the check boxes of Display Read Program/ Display Conversion Program in the ‘User Menu’ of LSMW Screen where we execute the steps (Initial Screen).


2. Now execute the Display Read Program Steps.


3. A Report will be displayed, set the break points at the required places.


4. Execute Read Data Step.


5. As soon as you execute the Read Data Step you will enter the debugging mode.


If you are facing the problem in Converted Data then you can set the Breakpoints in ‘Display Conversion Program’ after that execute the ‘Convert Data’ Step, you will enter the debugger.


Saturday, 25 May 2013

Workflow Log Analysis in SAP

Analyzing a workflow log place a very important role especially when you are in support project. Workflow log analysis helps us to find the root cause and to track the crux of any issues encountered in the workflow cycle.

In this blog we will see how to proceed when the Invoice (MIR4) related issue is faced wherein we have to track who is the agent responsible? When the agent responsible approved the invoice? Different rules to identify the Actual agent? Which IDoc is triggered? What kind of notification is set? And so on…

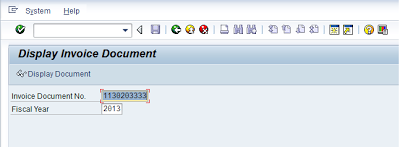
1. Run the T-Code MIR4 (Display Invoice Document). Input the invoice number for which you want to do the analysis and click on display document.


2. In the displayed invoice click on the GOS (Generic Object Services) object à Workflow à Workflow Overview.


3. As soon as you click on Workflow overview a popup will appear displaying the details of the Invoice workflow. Now click on display workflow log.


4. Now you will see workflow log screen. Suppose if you want to know who exactly are Actual / Possible / excluded  Agents, just click on any of the Agents button it will show you the respective agents.  One pint to remember here is that Actual Agents are mostly determined by using Rules, Positions and Expressions. An Actual agent must be one among the possible agents minus the excluded agents. You can find to which notification does the agent belongs in ‘PPOSE’ Tcode and in ‘SU01D’ Tcode you can find the agents details. Some times situation will arise where you have to debug the Rule used to determine the actual agent in order to find the actual agent.


5. If you want to know the technical details of the invoice workflow, click on table content button.


6. Now you will see Workflow Id which is nothing but task id which begins with WS followed by 8 digit number and different work items associated with workflow. In this the Container tab is just like a repository which stores the information regarding the various elements involved in Workflow.  You can find who has started the workflow, which business object is used, which IDoc is created and all the container elements. See to it that binding exists in all the container elements.


7. If you want to see the design of the workflow and insight settings of the workflow double click on the Task id WS90000117 or else execute the Tcode ‘SWDD’ and give the Task id you will see the workflow definition.


8. Now double click on any workflow step to know which business object is being used for the task, events that trigger that task and the rules defined to find the agents. In the default rules sub screen you can find the rules used. For invoice related workflows standard business object ‘BUS2081’ is used commonly.


9. Suppose if you want to execute the a particular work item of a workflow then run the ‘SWIA’ Tcode and provide the work item id and execute.


10. After executing, you will see the below screen which shows the work item status and work item type. Now you can do the administrative activities such as Replacing / Completing / Cancelling and so on for more on Cancelling work item refer my blog on Difference between logical and physical deletion of work items in SAP workflow


Talking about work item types and work item statuses,

There are basically 12 types of work items and you can see only 3 types of work items Dialog work item (W), Deadline work item (D) and Work item queue (A).
There are 11 types of work item statuses. The status SELECTED tells that the particular work item is reserved by the agent so that no other possible agents can execute that work item (Once the agent reserves the work item, that particular work item disappears from others’ agents Inbox).

The above steps are just the road map for analyzing workflow log. The concluding analysis depends on you how well you crack it and the kind of problem you encounter in the workflow.